AI-assisted phone photo review
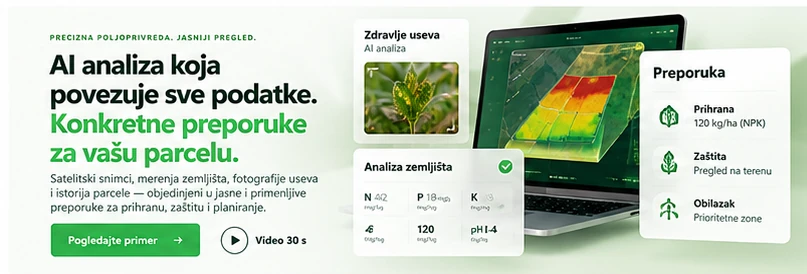
Optional photo analysis flags possible disease, pests, nutrient stress or other issues, with suggested checks rather than a guaranteed diagnosis.
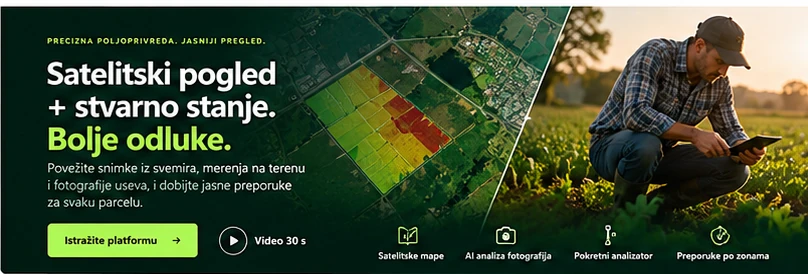
PRECISION AGRICULTURE. A CLEARER VIEW.
Satellite imagery, field observations, portable soil measurements and AI-assisted agronomic insights in one platform. Capture crop photos, measure soil and review recommendations before applying them.
Development pilot • Satellite monitoring • History over time
Illustrative visuals. AI photo analysis, portable probing and machinery integration are under development; field and agronomic verification are essential.
FROM FIELD TO TRACTOR
From satellite monitoring to a test ISOXML task and tractor.
Important: video illustrates an envisioned workflow. Percentages are illustrative marketing scenarios, not proven results. ISOXML remains TEST_ONLY; machine application has not been verified.
AGRO FIELD PRO
Concept images showing our development areas.
FROM IMAGERY TO A CLEARER VIEW
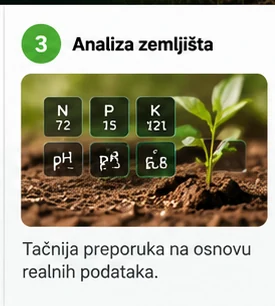
On the farm, select a measurement point on your phone, take repeated readings with a portable RS485 soil analyzer, capture crop photos and send the data to the web portal for AI-assisted review. Illustrative visuals. AI photo analysis, portable probing and machinery integration are under development; field and agronomic verification are essential.
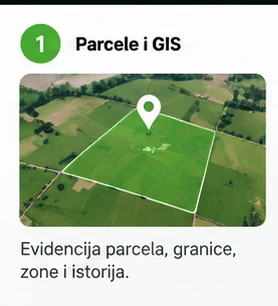
Choose field boundaries, crop and season. Keep imagery, observations and plans tied to the same field.
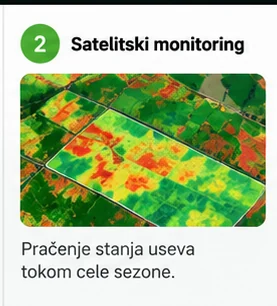
Compare NDVI, dates and usable imagery to identify areas that deserve a closer look.
Photograph crops, leaves or unusual symptoms. Optional AI image review suggests possible causes and what to check in the field.
Choose 1–8 sampling points (five recommended). An independent ESP32 reads an RS485 sensor, with three readings and a median per point.
Combine usable images, photos, soil readings, laboratory results and field history into explained suggestions and uncertainties.
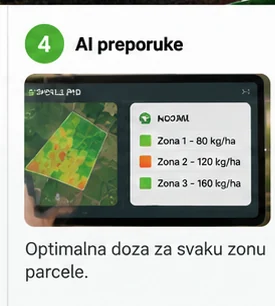
Review field variability, potential treatment zones, data limitations and agronomist approval before deciding real rates.
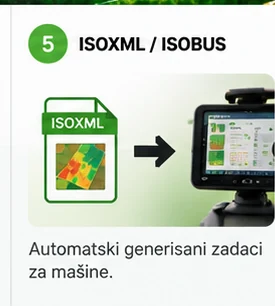
Validate geometry and create a TEST_ONLY ISOXML task. Server-side XSD testing with zero rates passed; terminal compatibility is not yet verified.
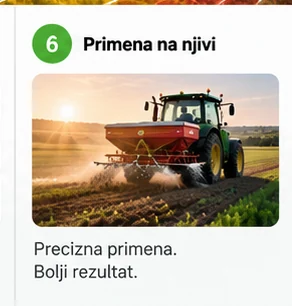
Real application requires agronomist approval and machine-terminal validation. The operator retains control.
One place for satellite records, field photos, crop history and soil sampling. Better scouting priorities and stronger evidence for managing input costs.
Optional photo analysis flags possible disease, pests, nutrient stress or other issues, with suggested checks rather than a guaranteed diagnosis.
Independent ESP32 plus RS485 sensor. One to eight points (five recommended), three readings and median per point; review extremes and confirm before AI analysis.
No autonomous tractor control or guaranteed diagnosis. Portable soil sampling and AI photo review are planned/integration features; real machine deployment is not verified.
Help with getting started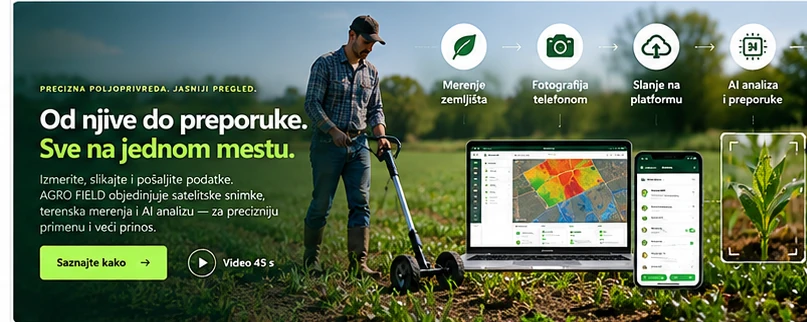
On the farm, select a measurement point on your phone, take repeated readings with a portable RS485 soil analyzer, capture crop photos and send the data to the web portal for AI-assisted review.
WHAT THE PLATFORM BRINGS TOGETHER
See what was measured, when the data was captured and which area it represents. Connect the map to practical questions about your field.
Combine satellite imagery, crop photographs, portable soil measurements and field history to identify areas worth checking and plan better-targeted actions.
Differences you can locate on the ground.
NDVI helps reveal parts of the field with different spectral responses. The date and accepted-data quality stay with the map, so you can understand the view before visiting the field.
Compare change on the same accepted area.
Return to a saved image or compare two dates. Differences use the common accepted footprint, so a changed mask is not presented as a change in vegetation.
From spatial grouping to a verifiable test plan.
Label manual test zones and check how they fit the field boundary. The test plan keeps a trace back to zones and geometry; recommendations and rates need a separate professional assessment.
Keep the field, season and data origin connected.
A useful view explains both the result and its limits. Guides help with date selection, NDVI interpretation and issue reporting without exposing passwords or access keys.
Clearer field zones and scouting priorities, better cost visibility, and machine-task preparation.
Illustrative optimization target.
Possible scenario under suitable agronomic conditions.
Up to 20% fertilizer saving and 15%+ yield growth are illustrative scenarios, not verified AGRO FIELD pilot outcomes.
AI-assisted phone photo review · Portable Soil Analyzer — One place for satellite records, field photos, crop history and soil sampling. Better scouting priorities and stronger evidence for managing input costs.
Combine satellite imagery, crop photographs, portable soil measurements and field history to identify areas worth checking and plan better-targeted actions.
SEE DATA IN CONTEXT
Choose a date, explore the vegetation map and follow spatial differences. The raster shows accepted pixels, while grid values are weighted by intersection area. Comparing dates requires the same accepted area, not just the same colour on a screen.
Understand an NDVI result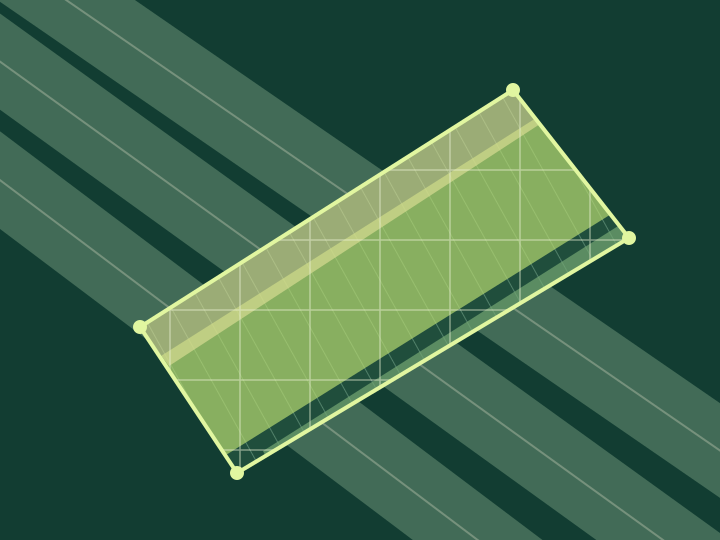 Vegetation / NDVIInterface illustration • development example
Values from the development example for 4 October 2026. The map illustrates the interface.
FOLLOW YOUR FIELD THROUGH TIME
One date gives a snapshot. Several saved images help you follow NDVI changes, identify areas to visit and connect the map with sowing and field observations.
THE CROP PROVIDES CONTEXT
Combine satellite imagery, crop photographs, portable soil measurements and field history to identify areas worth checking and plan better-targeted actions.
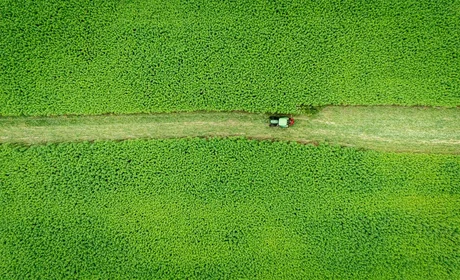
Spot uneven emergence and priority scouting zones in maize.
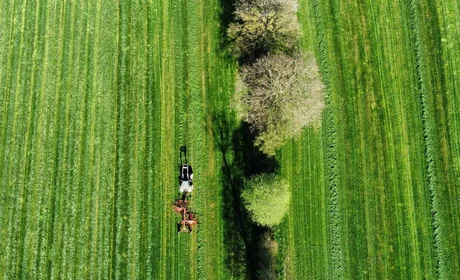
Compare wheat vigor over time before deciding on nitrogen checks.
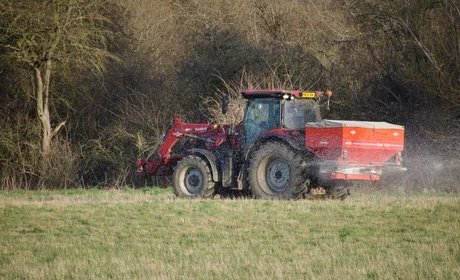
Identify weaker barley areas and review vegetation history.
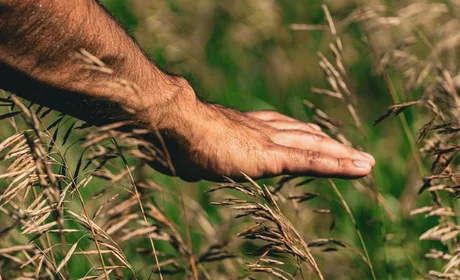
Track soybean differences with photos and field notes.
Find sunflower areas that deserve closer scouting.
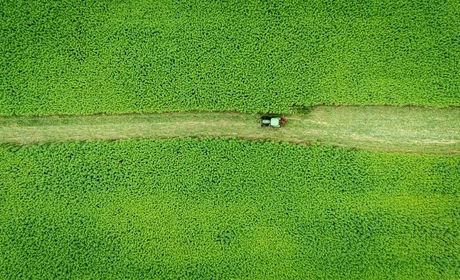
Review rapeseed changes and plan targeted field checks.
One place for satellite records, field photos, crop history and soil sampling. Better scouting priorities and stronger evidence for managing input costs.
SATELLITE DATA, STEP BY STEP
The saved boundary defines the area used for calculations. Each image is linked to the field, season and boundary version so older data is not silently applied to a changed field.
NDVI uses red and near-infrared bands. The mask separates accepted data from clouds, shadows and missing measurements. Missing coverage stays missing instead of becoming an invented zero.
The source raster and field grid serve different purposes. Cell values are weighted by their intersection with accepted pixels. Date comparisons use common accepted coverage and show how much area is comparable.
Up to three years of archive searching is on the roadmap. Scenes and cloud conditions are checked by field and date, then processing runs in bounded batches. Free sources come first; an additional paid source requires a suitable need, a visible quote, consent and a spending limit.
FROM FIELD TO EQUIPMENT
A map is the starting point. Variable-rate application depends on the display, software version, enabled features and implement controller. We assess the actual equipment combination rather than assuming compatibility from a tractor badge.
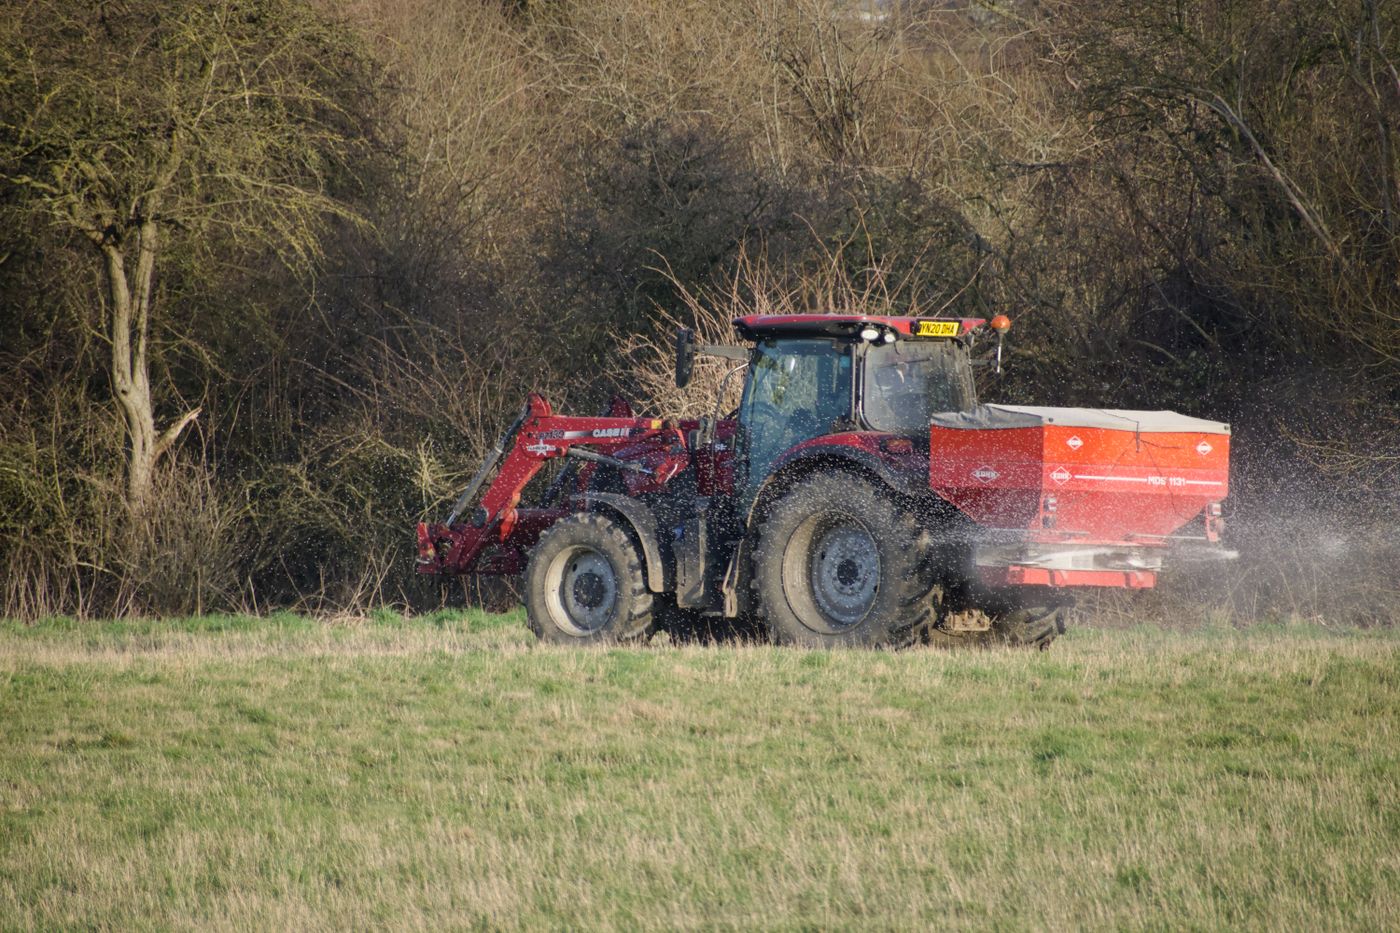
The zero-rate TEST_ONLY export passed XML schema and geometry checks. Import and execution on a specific display have not yet been verified.
Shapefile Rx export and selected display requirements are planned for testing. Manufacturer documentation does not constitute a verified AGRO FIELD integration.
ISOXML testing is planned with suitable Task Doc features. Display version, licences and implement configuration must be checked.
Next profiles will follow the equipment available to pilot users. We need the display model, software version and spreader or sprayer controller model.
No autonomous tractor control or guaranteed diagnosis. Portable soil sampling and AI photo review are planned/integration features; real machine deployment is not verified.
Precision tools may help reduce unnecessary inputs and support improved crop outcomes. Promotional percentages are not verified AGRO FIELD results.
FOR PEOPLE WHO WORK WITH THE LAND
Explore your fields, return to earlier imagery and prepare a visit to areas that deserve attention.
Use maps as another layer alongside field evidence and expert assessment. NDVI does not replace diagnosis or recommendations.
Organise data by farm and season. Administrative development keeps membership, support and future billing separate.
KNOWLEDGE IS PART OF THE TOOL
What does low NDVI mean? Why do two averages differ? When does an image lack accepted data? Our guides start with practical questions and clearly separate measurement, interpretation and decisions.
Help ↗Check the field and season, then the date. Registry images belong to the current boundary and grid version.
The simple mean of accepted pixels and the area-weighted mean use different weights and may differ.
There is no accepted measurement for that area. We do not replace it with a made-up zero or present it as evidence of poor vegetation.
The current export is for testing, with zero rates. Actual operation requires separate agronomic and terminal checks.
Include the field, season, image date and error message. Add a screenshot without passwords, access tokens or a Client Secret. This helps distinguish login, imagery availability and processing issues.
A lower value indicates a different spectral relationship, but does not identify its cause. Consider the crop, growth stage, soil, water and field scouting. NDVI alone is not a fertilizer instruction.
Sign in with your AGRO FIELD account, then choose your field and season.
These quotas are proposed for the beta. Prices and the launch date will be announced later.
Future billing is planned through Paddle, starting in its test environment. Billing is currently inactive.
One workflow: satellite imagery, field photos, portable soil analysis, AI review, zone mapping and equipment-ready planning.
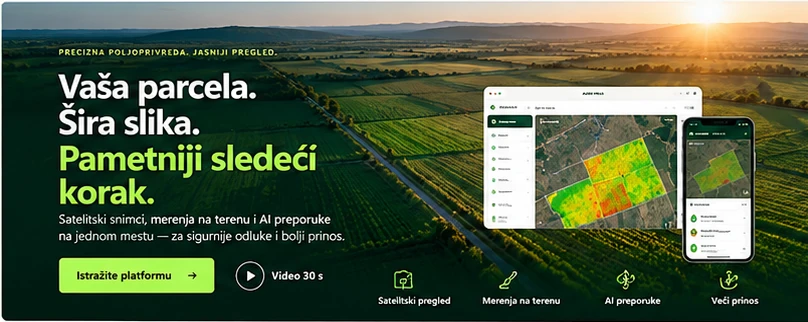
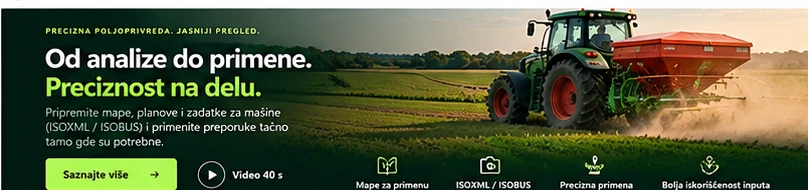
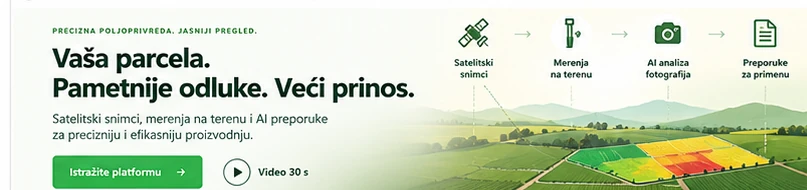
Illustrative visuals. AI photo analysis, portable probing and machinery integration are under development; field and agronomic verification are essential. Precision tools may help reduce unnecessary inputs and support improved crop outcomes. Promotional percentages are not verified AGRO FIELD results.
AGRO FIELD / BETA 1
Explore the workflow and development pilot. Public registration and billing are not open yet.